Welcome to Daily Market Analysis

Daily Stocks Pick: http://daytradingstock-blog.blogspot.com/

Market Index Technical analysis Alerts

Stocks Pick in 2013 - AAPL - BAC - ANR - MCP
Hottest Stocks in 2013 - ZNHE- VISN - GTN
Hottest Penny Stocks in 2013 - CHTP -INO- GSAT
My Daily Trading Activities - Membership Link
Showing posts with label December 2012. Show all posts

Saturday, December 29, 2012

Stock Market Technical Analysis for Next Week - December 31-January 4, 2012

During regular trading hours, there were many stocks that continued to break up to the upside. These stocks are usually going up  with news.If you are looking to day trade today, you might want to check out the following stocks. I usually throw these on my watch list and monitor with resistance & support levels.  My Daily Trading Activities & Stocks to Buy  Everyday   - Membership Access

Top Stocks Performance of the day:My Daily Trading Activities & Stocks to Buy  Everyday   Membership Access

Biggest Gainers 12/28/12
Composite Biggest Gainers 
YONG    Yongye International, Inc.    15.12%
CALL    magicJack VocalTec Ltd.    10.26%
CYCC    Cyclacel Pharmaceuticals, Inc.    4.98%
BKS    Barnes & Noble, Inc.    4.32%
IRDM    Iridium Communications Inc.    4.14%
LF    LeapFrog Enterprises Inc.    4.02%
HLF    Herbalife Ltd.    3.85%
ELGX    Endologix Inc.    3.77%
SSYS    Stratasys Inc.    3.60%
ACTG    Acacia Research Corporation    3.25%
SJT    San Juan Basin Royalty Trust    3.11%
MLNX    Mellanox Technologies, Ltd.    2.97%
SOHU    Sohu.com Inc.    2.90%
KRO    Kronos Worldwide Inc.    2.67%
BCDS    BCD Semiconductor Manufacturing Limited    2.56%
RKUS    Ruckus Wireless, Inc.    2.55%
KEP    Korea Electric Power Corp.    2.35%
CLSN    Celsion Corp.    2.25%
SINA    Sina Corp.    2.23%
DGIT    Digital Generation, Inc.    2.21%
HW    Headwaters Inc.    2.20%
LQDT    Liquidity Services, Inc.    2.15%
TSU    TIM Participacoes S.A.    1.99%
QIHU    Qihoo 360 Technology Co. Ltd    1.98%
RRD    R.R. Donnelley & Sons Company    1.83%
HK    Halc    1.79%
BSMX    Grupo Financiero Santander S.A.B. de C.V.    1.78%
TTM    Tata Motors Ltd.    1.58%
HTH    Hilltop Holdings Inc.    1.44%

Composite Biggest Losers 
Ticker     Company     Chang
OMER    Omeros Corporation    -8.90%
AH    Accretive Health, Inc.    -5.98%
CRZO    Carrizo Oil & Gas Inc.    -5.36%
ALDW    Alon USA Partners, LP    -5.30%
SZYM    Solazyme, Inc.    -4.08%
ZIP    Zipcar, Inc.    -4.03%
MWW    Monster Worldwide, Inc.    -3.94%
NIHD    NII Holdings Inc.    -3.85%
MAKO    MAKO Surgical Corp.    -3.82%
SANM    Sanmina-SCI Corp.    -3.82%
FST    Forest Oil Corp.    -3.48%
VVUS    VIVUS Inc.    -3.37%
UNTD    United Online, Inc.    -3.19%
GRMN    Garmin Ltd.    -3.17%
VIP    VimpelCom Ltd.    -3.07%
QCOR    Questcor Pharmaceuticals, Inc.    -3.06%
SRPT    Sarepta Therapeutics, Inc.    -3.06%
CMC    Commercial Metals Company    -3.03%
JBL    Jabil Circuit Inc.    -2.92%
KEG    Key Energy Services Inc.    -2.91%
ENTG    Entegris, Inc.    -2.88%
LEAP    Leap Wireless International Inc.    -2.88%
TROX    Tronox Incorporated    -2.85%
HOS    Hornbeck Offshore Services, Inc.    -2.84%
JCP    J. C. Penney Company, Inc.    -2.82%
SD    SandRidge Energy, Inc.    -2.81%
ING    ING Groep NV    -2.76%
VPHM    ViroPharma Inc.    -2.71%
AG    First Majestic Silver Corp.    -2.64%

 
SP 500

Long term signals
Bullish
Short term signals : Bearish

Stop  @ 1300

QQQ (Nasdaq 100) : 
Bearish, stop @ 50
INDU: Bullish, stop @10000
COMPQ:Bearish, stop @ 2300
Top trend : Techs  
Value : Financial

Euro Dollar : Bullish
US Dollar index : Bearish  
Gold : Bearish, stop @ 1500
10 Y US Yield : Bullish, above 2.8 stop
30 Y US Bond : Short, stop @ 132

World Market
UK's FTSE:  Bullish, stop @ 4700
Germany's DAX: Bullish, stop @ 5300
France's CAC: Bullish, stop @ 2900
Shanghai : Bearish
Japan Nikkei : Bearish

U.S. Major Index Performance MTD, QTD & YTD


Last 1 Week % Change MTD % Change QTD % Change YTD % Change
Dow 13135.01 -0.15% 0.84% -2.25% 7.51%
S&P 500 1413.58 -0.32% -0.18% -1.88% 12.40%
NASDAQ 2971.33 -0.23% -1.29% -4.65% 14.06%
CBOE VIX 17.00 6.92% 7.12% 8.07% -27.35%
The Dow Jones Industrial Average dropped 158.20 points, or 1.21 percent, to close at 12.938.11, dragged by Hewlett-Packard and ExxonMobil.

The S&P 500 slumped 15.67 points, or 1.11 percent, to end at 1,402.43. The Nasdaq declined 25.60 points, or 0.86 percent, to finish at 2,960.31. The CBOE Volatility Index (VIX), widely considered the best gauge of fear in the market, spiked to close above 22 for the first time since June.

For the week, the Dow tumbled 1.92 percent, the S&P 500 fell 1.94 percent, and the Nasdaq dropped 2.01 percent. Most Dow components ended in the red for the week, dragged by Hewlett-Packard and Microsoft, while Bank of America squeezed out a small gain.

I also have  technical analysis different stocks-Right Here.
 
Take a look some market indicator charts- Click all charts
$SPX - 60 min
SPX DAILY CHARTS
QUICK LOOK ALL MAJOR INDEX WEEKLY
$SPX with component chart 

$VIX
$CPC daily
QQQQ Daily 
COMPQ

 
FOR 12/31 SPX resistance, pivot &  support
Paid Membership
Membership Access
 
FOR Weekly 12/31-1/4 SPX resistance , pivot & support
Paid Membership 
Membership Access

For the latest updates on the stock market, visit,
http://dailymarketanalysis-blog.blogspot.com/
FTSE, DAX & CAC Index Charts & Top Performing Europe stocks - 12/31/12

My Daily Trading Activities & stocks ta analysis  - Membership Access
World Market : All charts are live
UK's FTSE
Daily chart
Weekly chart
 
Bearish, stop @ 4800

Germany's DAX: 
Daily chart
Weekly chart
 
Bearish, stop @ 4900

France's CAC:
Daily chart
Weekly chart  
Bearish, stop @ 2700

Shanghai :
Daily chart : Bearish
Japan Nikkei :
Bearish

Below these are weekly performance of Europe stock trading in USA ended  December 28, 2012.

Ticker    Company    Performance  
 
DLPH    Delphi Automotive PLC    4.66%
INXN    Interxion Holding NV    1.95%
ST    Sensata Technologies Holding NV    0.50%
VIP    VimpelCom Ltd.    0.29%
ALV    Autoliv, Inc.    0.08%
NNA    Navios Maritime Acquisition Corporation    0.00%
LYB    LyondellBasell Industries NV    -0.09%
TX    Ternium S.A.    -0.17%
RIO    Rio Tinto plc    -0.17%
WCRX    Warner Chilcott plc    -0.34%
TOT    Total SA    -0.60%
XL    XL Group plc    -0.76%
HBC    HSBC Holdings plc    -0.96%
ERIC    LM Ericsson Telephone Co.    -1.09%
FTE    France Telecom    -1.10%
NGG    National Grid plc    -1.17%
CLB    Core Laboratories NV    -1.18%
XRTX    Xyratex Ltd.    -1.19%
IRE    The Governor and Company of The Bank of Ireland    -1.23%
WSH    Willis Group Holdings Public Limited Company    -1.24%
STO    Statoil ASA    -1.28%
NVS    Novartis AG    -1.35%
STX    Seagate Technology PLC    -1.42%
E    Eni SpA    -1.48%
ABB    ABB Ltd.    -1.49%
RDS-B    Royal Dutch Shell plc    -1.52%
TI    Telecom Italia SpA    -1.54%
STM    STMicroelectronics NV    -1.55%
SNY    Sanofi    -1.58%
TEF    Telefonica, S.A.    -1.71%
BBL    BHP Billiton plc    -1.71%
VOD    Vodafone Group plc    -1.73%
CBI    Chicago Bridge & Iron Company N.V.    -1.74%
GSK    GlaxoSmithKline plc    -1.75%
CNH    CNH Global NV    -1.78%
AZN    AstraZeneca PLC    -1.82%
BUD    Anheuser-Busch InBev    -1.96%
PT    Portugal Telecom SGPS SA    -2.00%
BBVA    Banco Bilbao Vizcaya Argentaria, S.A.    -2.04%
SAP    SAP AG    -2.10%
TS    Tenaris SA    -2.12%
SI    Siemens AG    -2.24%
UN    Unilever NV    -2.27%
BP    BP plc    -2.39%
ASML    ASML Holding NV    -2.40%
YNDX    Yandex N.V.    -2.55%
NXPI    NXP Semiconductors NV    -2.69%
UL    Unilever plc    -2.72%
NEON    Neonode, Inc.    -2.85%
COV    Covidien plc    -2.88%
PHG    Koninklijke Philips Electronics NV    -2.91%
ICLR    ICON plc    -3.02%
TYC    Tyco International Ltd.    -3.09%
DEO    Diageo plc    -3.11%
ARMH    ARM Holdings plc    -3.18%
ACE    ACE Limited    -3.27%
VE    Veolia Environnement S.A.    -3.27%
DB    Deutsche Bank AG    -3.28%
AEG    AEGON N.V.    -3.55%
WFT    Weatherford International Ltd.    -3.82%
ING    ING Groep NV    -3.88%
MT    Arcelor Mittal    -3.88%
DSX    Diana Shipping Inc.    -4.00%
LYG    Lloyds Banking Group plc    -4.00%
QGEN    Qiagen NV    -4.03%
SB    Safe Bulkers, Inc.    -4.03%
NM    Navios Maritime Holdings Inc.    -4.07%
IR    Ingersoll-Rand Plc    -4.07%
BCS    Barclays PLC    -4.12%
TEL    TE Connectivity Ltd.    -4.24%
LOGI    Logitech International SA    -4.33%
ELN    Elan Corporation, plc    -4.47%
CS    Credit Suisse Group    -4.50%
ESV    Ensco plc    -4.51%
CPLP    Capital Product Partners L.P.    -4.67%
ACN    Accenture plc    -4.87%
RIG    Transocean Ltd.    -4.95%
NMM    Navios Maritime Partners L.P.    -5.20%
TNP    Tsakos Energy Navigation Ltd.    -5.24%
RYAAY    Ryanair Holdings plc    -5.76%
FWLT    Foster Wheeler AG    -5.78%
UBS    UBS AG    -5.85%
NE    Noble Corp.    -6.40%
AGRO    Adecoagro S.A.    -6.50%
AMRN    Amarin Corporation plc    -6.55%
VPRT    Vistaprint N.V.    -7.14%
NOK    Nokia Corporation    -8.85%
VELT    Velti Plc    -11.07%


For the latest updates on the stock market, visit,
http://dailymarketanalysis-blog.blogspot.com

Saturday, December 22, 2012

Stock Market Technical Analysis for Next Week - Dec 24-28, 2012

During regular trading hours, there were many stocks that continued to break up to the upside. These stocks are usually going up  with news.If you are looking to day trade today, you might want to check out the following stocks. I usually throw these on my watch list and monitor with resistance & support levels.  My Daily Trading Activities & Stocks to Buy  Everyday   - Membership Access

Top Stocks Performance of the day:My Daily Trading Activities & Stocks to Buy  Everyday   Membership Access

Biggest Gainers 12/21/12
Composite Biggest Gainers 
HALO    Halozyme Therapeutics, Inc.    26.99%
PNK    Pinnacle Entertainment Inc.    21.35%
ASCA    Ameristar Casinos Inc.    20.07%
FCFC    FirstCity Financial Corp.    16.87%
CEMI    Chembio Diagnostics, Inc.    14.35%
HOV    Hovnanian Enterprises Inc.    14.19%
ALJ    Alon USA Energy, Inc.    10.16%
WWAY    Westway Group, Inc.    10.03%
MX    MagnaChip Semiconductor Corporation    9.10%
TIBX    TIBCO Software Inc.    7.81%
NKE    Nike Inc.    6.16%
PANW    Palo Alto Networks, Inc.    5.56%
CBEY    Cbeyond, Inc.    5.06%
MHK    Mohawk Industries Inc.    4.88%
GNCMA    General Communication Inc.    4.76%
MLNX    Mellanox Technologies, Ltd.    4.67%
RHT    Red Hat, Inc.    4.52%
AEGR    Aegerion Pharmaceuticals, Inc.    4.43%
CIG    Cia Energetica de Minas Gerais    4.38%
OSIS    OSI Systems, Inc.    4.33%
FRED    Fred's, Inc.    4.06%
PLAB    Photronics Inc.    4.04%
Z    Zillow, Inc.    4.01%
MOG-A    Moog Inc.    3.88%
SPPI    Spectrum Pharmaceuticals, Inc.    3.72%
CATY    Cathay General Bancorp    3.72%
BCEI    Bonanza Creek Energy, Inc.    3.51%
ACCO    ACCO Brands Corporation    3.37%
UA    Under Armour, Inc.    3.35%
BLDR    Builders FirstSource, Inc.    3.31%
JW-A    John Wiley & Sons Inc.    3.22%
JMI    Javelin Mortgage Investment Corp    2.96%
IVC    Invacare Corporation    2.92%
HHS    Harte-Hanks Inc.    2.89%
TROX    Tronox Incorporated    2.89%
RFP    Resolute Forest Products Inc.    2.88%
CR    Crane Co.    2.87%
DPM    DCP Midstream Partners LP    2.87%
LOGM    LogMeIn, Inc.    2.86%

Composite Biggest Losers 
Ticker     Company     Chang
RIMM    Research In Motion Limited    -22.73%
HLF    Herbalife Ltd.    -19.08%
NUS    Nu Skin Enterprises Inc.    -13.62%
GBX    Greenbrier Companies    -11.12%
GDI    Gardner Denver Inc.    -10.78%
EDMC    Education Management Corporation    -9.91%
CYCC    Cyclacel Pharmaceuticals, Inc.    -9.08%
GTIV    Gentiva Health Services Inc.    -9.00%
JKS    JinkoSolar Holding Co., Ltd.    -8.65%
RECN    Resources Connection Inc.    -8.55%
NX    Quanex Building Products Corporation    -8.43%
BTH    Blyth, Inc.    -8.16%
TUES    Tuesday Morning Corp.    -7.70%
SHLD    Sears Holdings Corporation    -7.69%
AMED    Amedisys Inc.    -7.05%
MU    Micron Technology Inc.    -6.92%
ALXA    Alexza Pharmaceuticals Inc.    -6.91%
WBMD    WebMD Health Corp.    -6.68%
KBR    KBR, Inc.    -6.10%
VHC    VirnetX Holding Corp    -6.00%
DAR    Darling International Inc.    -5.94%
ESI    ITT Educational Services Inc.    -5.73%
UNXL    Uni-Pixel Inc.    -5.67%
UBSI    United Bankshares Inc.    -5.49%
NSIT    Insight Enterprises Inc.    -5.46%
SID    Companhia Siderurgica Nacional    -5.34%
APOG    Apogee Enterprises, Inc.    -5.25%
TREX    Trex Co. Inc.    -4.94%
QSII    Quality Systems Inc.    -4.86%
PNRA    Panera Bread Co.    -4.85%
MDVN    Medivation, Inc.    -4.74%
USNA    USANA Health Sciences Inc.    -4.68%
SMBL    Smart Balance, Inc    -4.63%
LPL    LG Display Co., Ltd.    -4.60%
CAMP    CalAmp Corp.    -4.43%
FSL    Freescale Semiconductor Holdings I, Ltd.    -4.38%
SGMO    Sangamo Biosciences Inc.    -4.38%
ARNA    Arena Pharmaceuticals, Inc.    -4.32%
IRBT    iRobot Corporation    -4.31%

 
SP 500

Long term signals
Bullish
Short term signals : Bearish

Stop  @ 1300

QQQ (Nasdaq 100) : 
Bearish, stop @ 50
INDU: Bullish, stop @10000
COMPQ:Bearish, stop @ 2300
Top trend : Techs  
Value : Financial

Euro Dollar : Bullish
US Dollar index : Bearish  
Gold : Bearish, stop @ 1500
10 Y US Yield : Bullish, above 2.8 stop
30 Y US Bond : Short, stop @ 132

World Market
UK's FTSE:  Bullish, stop @ 4700
Germany's DAX: Bullish, stop @ 5300
France's CAC: Bullish, stop @ 2900
Shanghai : Bearish
Japan Nikkei : Bearish


Stocks ended near session lows in light volume trading Friday, dragged by techs, as investors remained on the sidelines ahead of the weekend amid ongoing worries over the looming "fiscal cliff."

All three major averages finished in the red for the week.

The Dow Jones Industrial Average declined for a third session, sliding 35.71 points, or 0.27 percent, to close at 13,135.01, led by American Express and Microsoft. Hewlett-Packard led the blue-chip gainers.

The S&P 500 dropped 5.87 points, or 0.41, to end at 1,413.58. The Nasdaq fell 20.83 points, or 0.70 percent, to finish at 2,971.33.

The CBOE Volatility Index (VIX), widely considered the best gauge of fear in the market, ended at 17.


I also have  technical analysis different stocks-Right Here.
 
Take a look some market indicator charts- Click all charts
$SPX - 60 min
SPX DAILY CHARTS
QUICK LOOK ALL MAJOR INDEX WEEKLY
$SPX with component chart 

$VIX
$CPC daily
QQQQ Daily 
COMPQ

 
FOR 12/24 SPX resistance, pivot &  support
Paid Membership
Membership Access
 
FOR Weekly 12/24-12/28 SPX resistance , pivot & support
Paid Membership 
Membership Access

For the latest updates on the stock market, visit,
http://dailymarketanalysis-blog.blogspot.com/

FTSE, DAX & CAC Index Charts & Top Performing Europe stocks - 12/22/12

My Daily Trading Activities & stocks ta analysis  - Membership Access
World Market : All charts are live
UK's FTSE
Daily chart
Weekly chart
 
Bearish, stop @ 4800

Germany's DAX: 
Daily chart
Weekly chart
 
Bearish, stop @ 4900

France's CAC:
Daily chart
Weekly chart  
Bearish, stop @ 2700

Shanghai :
Daily chart : Bearish
Japan Nikkei :
Bearish

Below these are weekly performance of Europe stock trading in USA ended  December 21, 2012.

Ticker    Company    Performance  
 
VELT    Velti Plc    38.80%
TNP    Tsakos Energy Navigation Ltd.    17.65%
FLTX    Fleetmatics Group Limited    14.28%
STX    Seagate Technology PLC    10.16%
CBI    Chicago Bridge & Iron Company N.V.    8.68%
TX    Ternium S.A.    7.53%
SB    Safe Bulkers, Inc.    6.75%
ALV    Autoliv, Inc.    6.04%
AVG    AVG Technologies N.V.    5.91%
NE    Noble Corp.    5.90%
TS    Tenaris SA    5.71%
DLPH    Delphi Automotive PLC    5.49%
RBS    The Royal Bank of Scotland Group plc    5.45%
IOSP    Innospec Inc.    5.21%
ST    Sensata Technologies Holding NV    5.21%
ARMH    ARM Holdings plc    5.15%
QGEN    Qiagen NV    5.00%
AEG    AEGON N.V.    4.79%
BBVA    Banco Bilbao Vizcaya Argentaria, S.A.    4.73%
NOK    Nokia Corporation    4.45%
DCIX    Diana Containerships Inc.    4.17%
ESV    Ensco plc    4.01%
YNDX    Yandex N.V.    3.65%
LYG    Lloyds Banking Group plc    3.64%
TEL    TE Connectivity Ltd.    3.54%
NXPI    NXP Semiconductors NV    3.47%
BCS    Barclays PLC    3.45%
RIO    Rio Tinto plc    3.39%
VE    Veolia Environnement S.A.    3.38%
CLB    Core Laboratories NV    3.15%
TYC    Tyco International Ltd.    2.91%
STM    STMicroelectronics NV    2.89%
FWLT    Foster Wheeler AG    2.64%
E    Eni SpA    2.63%
LYB    LyondellBasell Industries NV    2.51%
ELN    Elan Corporation, plc    2.49%
BBL    BHP Billiton plc    2.38%
ABB    ABB Ltd.    2.31%
ERIC    LM Ericsson Telephone Co.    2.24%
RIG    Transocean Ltd.    2.22%
XRTX    Xyratex Ltd.    2.19%
PT    Portugal Telecom SGPS SA    2.03%
DB    Deutsche Bank AG    1.96%
DSX    Diana Shipping Inc.    1.91%
CPLP    Capital Product Partners L.P.    1.86%
INXN    Interxion Holding NV    1.80%
ANW    Aegean Marine Petroleum Network Inc.    1.80%
BP    BP plc    1.76%
MTD    Mettler-Toledo International, Inc.    1.53%
STO    Statoil ASA    1.51%
TOT    Total SA    1.45%
WFT    Weatherford International Ltd.    1.40%
CNH    CNH Global NV    1.24%
SNY    Sanofi    1.23%
HBC    HSBC Holdings plc    1.21%
TEF    Telefonica, S.A.    1.13%
XL    XL Group plc    1.11%
ACE    ACE Limited    0.95%
SI    Siemens AG    0.92%
TKC    Turkcell Iletisim Hizmetleri AS    0.90%
AER    AerCap Holdings N.V.    0.66%
LOGI    Logitech International SA    0.65%
PHG    Koninklijke Philips Electronics NV    0.53%
RDS-B    Royal Dutch Shell plc    0.47%
RYAAY    Ryanair Holdings plc    0.45%
MT    Arcelor Mittal    0.35%
NGG    National Grid plc    0.26%
COV    Covidien plc    0.26%
CS    Credit Suisse Group    0.16%
SYT    Syngenta AG    0.05%
AZN    AstraZeneca PLC    0.02%
NVS    Novartis AG    0.00%
WCRX    Warner Chilcott plc    -0.17%
ASML    ASML Holding NV    -0.31%
ICLR    ICON plc    -0.46%
UN    Unilever NV    -0.52%
UL    Unilever plc    -0.61%
NVO    Novo Nordisk A/S    -0.65%
CUK    Carnival plc    -0.68%
PUK    Prudential plc    -0.81%
NMM    Navios Maritime Partners L.P.    -0.87%
FTE    France Telecom    -0.89%
DEO    Diageo plc    -0.91%
IRE    The Governor and Company of The Bank of Ireland    -0.92%
BUD    Anheuser-Busch InBev    -0.93%
SAP    SAP AG    -0.97%
IR    Ingersoll-Rand Plc    -1.03%
GSK    GlaxoSmithKline plc    -1.07%
AWH    Allied World Assurance Company Holdings, AG    -1.14%
VIP    VimpelCom Ltd.    -1.45%
FMS    Fresenius Medical Care AG & Co. KGAA    -1.47%
ING    ING Groep NV    -1.69%
WSH    Willis Group Holdings Public Limited Company    -1.79%
TRNX    Tornier N.V.    -1.85%
TI    Telecom Italia SpA    -1.95%
NM    Navios Maritime Holdings Inc.    -1.99%
UBS    UBS AG    -2.39%
VOD    Vodafone Group plc    -2.71%
TI-A    Telecom Italia SpA    -3.05%
VPRT    Vistaprint N.V.    -3.21%
BTI    British American Tobacco plc    -3.50%
ACN    Accenture plc    -3.97%
NEON    Neonode, Inc.    -4.14%
AMRN    Amarin Corporation plc    -9.95%


For the latest updates on the stock market, visit,
http://dailymarketanalysis-blog.blogspot.com

Saturday, December 15, 2012

FTSE, DAX & CAC Index Charts & Top Performing Europe stocks - 12/15/12

My Daily Trading Activities & stocks ta analysis  - Membership Access
World Market : All charts are live
UK's FTSE
Daily chart
Weekly chart
 
Bearish, stop @ 4800

Germany's DAX: 
Daily chart
Weekly chart
 
Bearish, stop @ 4900

France's CAC:
Daily chart
Weekly chart  
Bearish, stop @ 2700

Shanghai :
Daily chart : Bearish
Japan Nikkei :
Bearish

Below these are weekly performance of Europe stock trading in USA ended  December 14, 2012.

Ticker    Company    Performance  
 
NEON    Neonode, Inc.    27.78%
AVG    AVG Technologies N.V.    12.31%
VPRT    Vistaprint N.V.    11.10%
ALU    Alcatel-Lucent, S.A.    10.71%
MT    Arcelor Mittal    8.04%
PT    Portugal Telecom SGPS SA    7.88%
DRYS    DryShips, Inc.    7.65%
STM    STMicroelectronics NV    6.79%
XRTX    Xyratex Ltd.    5.45%
WCRX    Warner Chilcott plc    5.12%
NXPI    NXP Semiconductors NV    5.11%
VE    Veolia Environnement S.A.    4.81%
RIO    Rio Tinto plc    4.81%
FTE    France Telecom    4.78%
BBL    BHP Billiton plc    4.27%
BBVA    Banco Bilbao Vizcaya Argentaria, S.A.    3.98%
INXN    Interxion Holding NV    3.84%
IOSP    Innospec Inc.    3.82%
VELT    Velti Plc    3.78%
TOT    Total SA    3.77%
E    Eni SpA    3.48%
ICLR    ICON plc    3.44%
TEF    Telefonica, S.A.    3.26%
CNH    CNH Global NV    3.08%
ELN    Elan Corporation, plc    3.07%
SI    Siemens AG    3.00%
NBG    National Bank of Greece SA    2.81%
AER    AerCap Holdings N.V.    2.47%
MTD    Mettler-Toledo International, Inc.    2.46%
ABB    ABB Ltd.    2.36%
RDS-B    Royal Dutch Shell plc    2.23%
BCS    Barclays PLC    2.23%
AEG    AEGON N.V.    2.19%
TI-A    Telecom Italia SpA    2.12%
LOGI    Logitech International SA    1.99%
STO    Statoil ASA    1.86%
SAP    SAP AG    1.86%
GSK    GlaxoSmithKline plc    1.85%
TS    Tenaris SA    1.68%
DCIX    Diana Containerships Inc.    1.59%
CBI    Chicago Bridge & Iron Company N.V.    1.58%
RYAAY    Ryanair Holdings plc    1.56%
ERIC    LM Ericsson Telephone Co.    1.55%
SNY    Sanofi    1.51%
FWLT    Foster Wheeler AG    1.47%
NVS    Novartis AG    1.40%
PSO    Pearson plc    1.38%
ALV    Autoliv, Inc.    1.29%
ING    ING Groep NV    1.18%
NVO    Novo Nordisk A/S    1.15%
ACN    Accenture plc    1.05%
UN    Unilever NV    1.05%
UBS    UBS AG    0.99%
UL    Unilever plc    0.98%
TI    Telecom Italia SpA    0.88%
DLPH    Delphi Automotive PLC    0.85%
RBS    The Royal Bank of Scotland Group plc    0.83%
BP    BP plc    0.78%
PHG    Koninklijke Philips Electronics NV    0.77%
TEL    TE Connectivity Ltd.    0.72%
HBC    HSBC Holdings plc    0.68%
BUD    Anheuser-Busch InBev    0.65%
CS    Credit Suisse Group    0.57%
NGG    National Grid plc    0.51%
CMRE    Costamare Inc.    0.43%
VIP    VimpelCom Ltd.    0.36%
TNP    Tsakos Energy Navigation Ltd.    0.31%
SB    Safe Bulkers, Inc.    0.31%
LUX    Luxottica Group SpA    0.29%
SYT    Syngenta AG    0.24%
ASML    ASML Holding NV    0.22%
DSX    Diana Shipping Inc.    0.14%
LYB    LyondellBasell Industries NV    -0.04%
BTI    British American Tobacco plc    -0.11%
VOD    Vodafone Group plc    -0.19%
IRE    The Governor and Company of The Bank of Ireland    -0.31%
TYC    Tyco International Ltd.    -0.38%
FMS    Fresenius Medical Care AG & Co. KGAA    -0.46%
NOK    Nokia Corporation    -0.78%
NMM    Navios Maritime Partners L.P.    -0.78%
IHG    Intercontinental Hotels Group plc    -0.82%
ESV    Ensco plc    -0.97%
COV    Covidien plc    -1.09%
STX    Seagate Technology PLC    -1.14%
WSH    Willis Group Holdings Public Limited Company    -1.19%
CLB    Core Laboratories NV    -1.27%
ACE    ACE Limited    -1.44%
AZN    AstraZeneca PLC    -1.54%
ARMH    ARM Holdings plc    -1.56%
QGEN    Qiagen NV    -1.73%
IR    Ingersoll-Rand Plc    -1.92%
DEO    Diageo plc    -2.16%
ST    Sensata Technologies Holding NV    -2.30%
PUK    Prudential plc    -2.42%
LYG    Lloyds Banking Group plc    -2.58%
XL    XL Group plc    -2.76%
NE    Noble Corp.    -2.81%
WFT    Weatherford International Ltd.    -2.82%
RIG    Transocean Ltd.    -3.21%
AWH    Allied World Assurance Company Holdings, AG    -3.33%
TKC    Turkcell Iletisim Hizmetleri AS    -3.35%
DB    Deutsche Bank AG    -4.42%
NM    Navios Maritime Holdings Inc.    -5.65%
TEU    Box Ships Inc.    -5.72%
TX    Ternium S.A.    -5.98%
CPLP    Capital Product Partners L.P.    -6.11%
YNDX    Yandex N.V.    -6.93%
ASPS    Altisource Portfolio Solutions S.A.    -7.74%
AMRN    Amarin Corporation plc    -8.82%


For the latest updates on the stock market, visit,
http://dailymarketanalysis-blog.blogspot.com

Saturday, December 8, 2012

FTSE, DAX & CAC Index Charts & Top Performing Europe stocks - 12/8/12

My Daily Trading Activities & stocks ta analysis  - Membership Access
World Market : All charts are live
UK's FTSE
Daily chart
Weekly chart
 
Bearish, stop @ 4800

Germany's DAX: 
Daily chart
Weekly chart
 
Bearish, stop @ 4900

France's CAC:
Daily chart
Weekly chart  
Bearish, stop @ 2700

Shanghai :
Daily chart : Bearish
Japan Nikkei :
Bearish

Below these are weekly performance of Europe stock trading in USA ended  December 7, 2012.

Ticker    Company    Performance  
 
STX    Seagate Technology PLC    12.91%
LYB    LyondellBasell Industries NV    8.20%
IRE    The Governor and Company of The Bank of Ireland    8.13%
TKC    Turkcell Iletisim Hizmetleri AS    6.34%
WFT    Weatherford International Ltd.    5.57%
YNDX    Yandex N.V.    5.22%
RIO    Rio Tinto plc    5.22%
ING    ING Groep NV    3.89%
SNY    Sanofi    3.81%
VIP    VimpelCom Ltd.    3.69%
CS    Credit Suisse Group    3.43%
AEG    AEGON N.V.    3.31%
ERIC    LM Ericsson Telephone Co.    3.19%
MT    Arcelor Mittal    3.16%
XL    XL Group plc    3.12%
UBS    UBS AG    3.06%
FWLT    Foster Wheeler AG    2.89%
ABB    ABB Ltd.    2.42%
ACN    Accenture plc    2.30%
ACE    ACE Limited    2.20%
TEL    TE Connectivity Ltd.    1.99%
BCS    Barclays PLC    1.96%
STM    STMicroelectronics NV    1.89%
ALV    Autoliv, Inc.    1.62%
DB    Deutsche Bank AG    1.56%
ASML    ASML Holding NV    1.49%
AZN    AstraZeneca PLC    1.39%
SAP    SAP AG    1.19%
CBI    Chicago Bridge & Iron Company N.V.    1.16%
HBC    HSBC Holdings plc    1.08%
BBVA    Banco Bilbao Vizcaya Argentaria, S.A.    1.07%
NE    Noble Corp.    1.04%
TYC    Tyco International Ltd.    1.02%
UL    Unilever plc    0.94%
CNH    CNH Global NV    0.82%
UN    Unilever NV    0.74%
DEO    Diageo plc    0.74%
GSK    GlaxoSmithKline plc    0.72%
NVS    Novartis AG    0.44%
VOD    Vodafone Group plc    0.29%
COV    Covidien plc    0.05%
ST    Sensata Technologies Holding NV    0.03%
DLPH    Delphi Automotive PLC    -0.06%
RIG    Transocean Ltd.    -0.15%
IR    Ingersoll-Rand Plc    -0.18%
BUD    Anheuser-Busch InBev    -0.25%
FTE    France Telecom    -0.37%
ESV    Ensco plc    -0.50%
PSO    Pearson plc    -0.79%
TOT    Total SA    -0.80%
TEF    Telefonica, S.A.    -1.00%
STO    Statoil ASA    -1.07%
BP    BP plc    -1.65%
ELN    Elan Corporation, plc    -2.20%
ARMH    ARM Holdings plc    -2.28%
TS    Tenaris SA    -2.90%
QGEN    Qiagen NV    -3.19%
WCRX    Warner Chilcott plc    -4.55%
NXPI    NXP Semiconductors NV    -4.78%
DCIX    Diana Containerships Inc.    -7.80%
AMRN    Amarin Corporation plc    -21.92%


For the latest updates on the stock market, visit,
http://dailymarketanalysis-blog.blogspot.com

Sunday, December 2, 2012

Stock Market Technical Analysis for Next Week - Dec 3-6, 2012

During regular trading hours, there were many stocks that continued to break up to the upside. These stocks are usually going up  with news.If you are looking to day trade today, you might want to check out the following stocks. I usually throw these on my watch list and monitor with resistance & support levels.  My Daily Trading Activities & Stocks to Buy  Everyday   - Membership Access

Top Stocks Performance of the day:My Daily Trading Activities & Stocks to Buy  Everyday   Membership Access

Biggest Gainers 11/30/12
Composite Biggest Gainers
 
FIVE    Five Below, Inc.    18.35%
HALO    Halozyme Therapeutics, Inc.    9.11%
LQDT    Liquidity Services, Inc.    8.54%
CISG    Cninsure Inc.    8.37%
QLTY    Quality Distribution Inc.    8.25%
SGYP    Synergy Pharmaceuticals, Inc.    8.01%
ENZN    Enzon Pharmaceuticals Inc.    7.88%
ULTA    Ulta Salon, Cosmetics & Fragrance, Inc.    7.65%
CLSN    Celsion Corp.    7.30%
MPO    Midstates Petroleum Company, Inc.    7.01%
ACTV    The Active Network, Inc.    6.14%
WLT    Walter Energy, Inc.    5.78%
KEG    Key Energy Services Inc.    5.35%
THRX    Theravance Inc.    5.05%
PCS    MetroPCS Communications, Inc.    5.03%
ELGX    Endologix Inc.    4.94%
BLOX    Infoblox Inc.    4.93%
MACK    Merrimack Pharmaceuticals, Inc.    4.85%
IMPV    Imperva Inc.    4.77%
PFPT    Proofpoint, Inc.    4.76%
ALXA    Alexza Pharmaceuticals Inc.    4.76%
GNMK    GenMark Diagnostics, Inc.    4.76%
Z    Zillow, Inc.    4.72%
HMST    HomeStreet, Inc.    4.63%
RES    RPC Inc.    4.52%
NSM    Nationstar Mortgage Holdings Inc.    4.19%
ANR    Alpha Natural Resources, Inc.    4.18%
LEAP    Leap Wireless International Inc.    4.17%
GVA    Granite Construction Incorporated    4.15%


Composite Biggest Losers 
Ticker
    Company     Chang
NTLS    NTELOS Holdings Corp.    -20.22%
SUPN    Supernus Pharmaceuticals, Inc.    -18.72%
VRSN    VeriSign, Inc.    -13.19%
MDRX    Allscripts Healthcare Solutions, Inc.    -10.47%
YUM    Yum! Brands, Inc.    -9.92%
GCO    Genesco Inc.    -8.65%
QCOR    Questcor Pharmaceuticals, Inc.    -8.06%
NXST    Nexstar Broadcasting Group Inc.    -7.02%
CBE    Cooper Industries plc    -6.11%
SAAS    inContact, Inc.    -5.97%
REGN    Regeneron Pharmaceuticals, Inc.    -5.96%
INSM    Insmed Incorporated    -5.67%
DDD    3D Systems Corp.    -5.17%
OVTI    OmniVision Technologies Inc.    -5.03%
CLDX    Celldex Therapeutics, Inc.    -4.96%
GGB    Gerdau S.A.    -4.82%
TSRO    Tesaro, Inc.    -4.59%
ABMD    Abiomed Inc.    -4.23%
MMR    McMoRan Exploration Co.    -4.16%
BSFT    BroadSoft, Inc.    -4.06%
GDP    Goodrich Petroleum Corp.    -4.05%
RGLD    Royal Gold, Inc.    -3.85%
EDU    New Oriental Education & Technology Group    -3.82%
MYGN    Myriad Genetics Inc.    -3.79%
UA    Under Armour, Inc.    -3.72%
SEM    Select Medical Holdings Corporation    -3.58%
HOV    Hovnanian Enterprises Inc.    -3.51%
SGY    Stone Energy Corp.    -3.49%
CACI    CACI International Inc.    -3.40%

 
SP 500

Long term signals
Bullish
Short term signals : Bearish

Stop  @ 1300

QQQ (Nasdaq 100) : 
Bearish, stop @ 50
INDU: Bullish, stop @10000
COMPQ:Bearish, stop @ 2300
Top trend : Techs  
Value : Financial

Euro Dollar : Bullish
US Dollar index : Bearish  
Gold : Bearish, stop @ 1500
10 Y US Yield : Bullish, above 2.8 stop
30 Y US Bond : Short, stop @ 132

World Market
UK's FTSE:  Bullish, stop @ 4700
Germany's DAX: Bullish, stop @ 5300
France's CAC: Bullish, stop @ 2900
Shanghai : Bearish
Japan Nikkei : Bearish


Stocks ended narrowly mixed in lackluster trading on the final day of November, as investors were reluctant to make big bets ahead of the weekend amid ongoing "fiscal cliff" discussions.

Stocks have been choppy in the recent weeks as investors reacted to a chain of mixed remarks from lawmakers in Washington on the progress of the fiscal cliff talks.

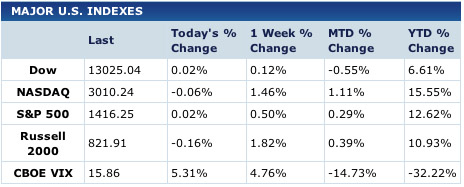
The Dow Jones Industrial Average eked out a gain of 3.76 points to close at 13,025.04 in volatile trading. Wal-Mart gained, while Microsoft lagged.

The S&P 500 squeezed out a gain of 0.23 points to end at 1,416.25, while the Nasdaq slipped 1.79 points, to finish at 3,010.24. Both indexes ended in positive territory for the month. The CBOE Volatility Index, widely considered the best gauge of fear in the market, finished near 16.

For the month, the Dow slipped 0.55 percent, while the S&P 500 rose 0.29 percent, and the Nasdaq rallied 1.11 percent. Intel was the worst monthly performer on the Dow, while Cisco soared. 


On Tap Next Week:

MONDAY: ISM manufacturing index, construction spending, Fed's Bullard speaks, auto sales; Earnings from PepBoys
 

TUESDAY: Earnings from AutoZone, Toll Brothers, Pandora, Mattress Firm
 

WEDNESDAY: Weekly mortgage apps, ADP employment report, productivity & costs, factory orders, ISM non-mfg index, oil inventories; Earnings from Men's Warehouse
 

THURSDAY: BoE announcement, Challenger job-cut report, ECB announcement, jobless claims, quarterly services survey, Apple/Samsung hearing; Earnings from H&R Block, Lululemon, Smithfield Foods, Cooper Cos.
 

FRIDAY: Employment situation, consumer sentiment, consumer credit 

Support for the SPX remains at 1400 and then 1370 with resistance at 1417 and then 1434
.So we should trade small lot.Take a look all 1/5/15/60m chart if we want to trade this market. 

I also have  technical analysis different stocks-Right Here.
 
Take a look some market indicator charts- Click all charts
$SPX - 60 min
SPX DAILY CHARTS
QUICK LOOK ALL MAJOR INDEX WEEKLY
$SPX with component chart 

$VIX
$CPC daily
QQQQ Daily 
COMPQ

FOR 12/3 SPX resistance, pivot &  support
Paid Membership
Membership Access
 
FOR Weekly 12/3-12/6 SPX resistance , pivot & support
Paid Membership 
Membership Access

For the latest updates on the stock market, visit,
http://dailymarketanalysis-blog.blogspot.com/